
says that you are visitor number
since Apr 20, 2020.
The page's
says that you are visitor number
since Apr 20, 2020.
Valori aggiornati quotidianamente dell'Indice Rt nazionale, in Campania e in Lombardia. I dati sono preliminari perché il calcolo č molto piů complesso, mentre qui č adoperato un metodo semplificato. Inoltre, il valore di Rt si riferisce alla data attuale, mentre il Dipartimento della Protezione Civile pubblica valori riferiti ad almeno 15 giorni prima.
Rt>1 č caratteristico della fase esponenziale o fase 1, Rt=1 della fase lineare, Rt<1 denota una fase decrescente, mentre Rt=0.5 č il limite per il passaggio alla fase 2.
Il passaggio alla fase 2 non dipende solo da questo parametro, ma anche dall'organizzazione delle strutture sanitarie, cioč dalla capacitŕ di diagnosticare i nuovi casi, di tracciare i contatti e di praticare una terapia efficiente sui pazienti.
Daily update values of the National, Campania and Lombardia Rt Index. Data are preliminary because the computation is much more complex, while a simplified method is used here. In addition, Rt is referred to tha actual value, while the Italian Civil Protection Department publishes earlier data, at least 15 days before.
Rt>1 is characteristic of exponential phase or phase 1, Rt=1 of the linear phase, Rt<1 denotes a decreasing phase, while Rt=0.5 is the limit for transition to phase 2.
The transition to phase 2 depends not only on this parameter, but also on the organization of healthcare facilities, i.e. the ability to diagnose new cases, to trace contacts and to practice an efficient therapy on patients.
Italia | 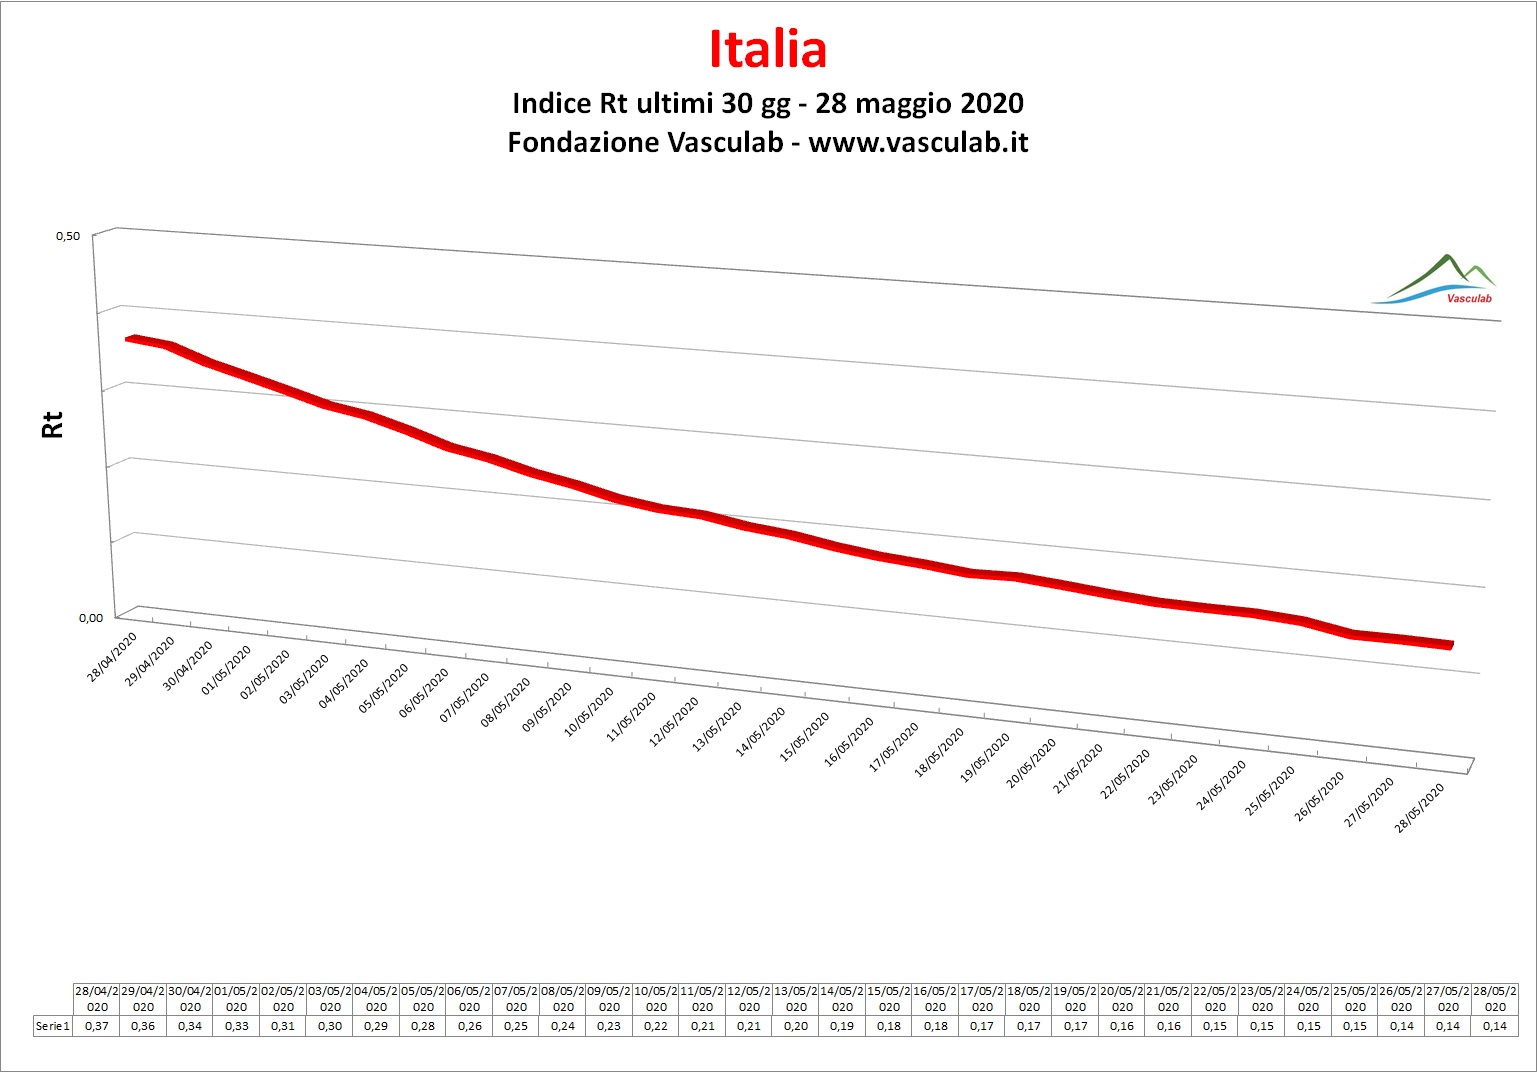 |
Campania | 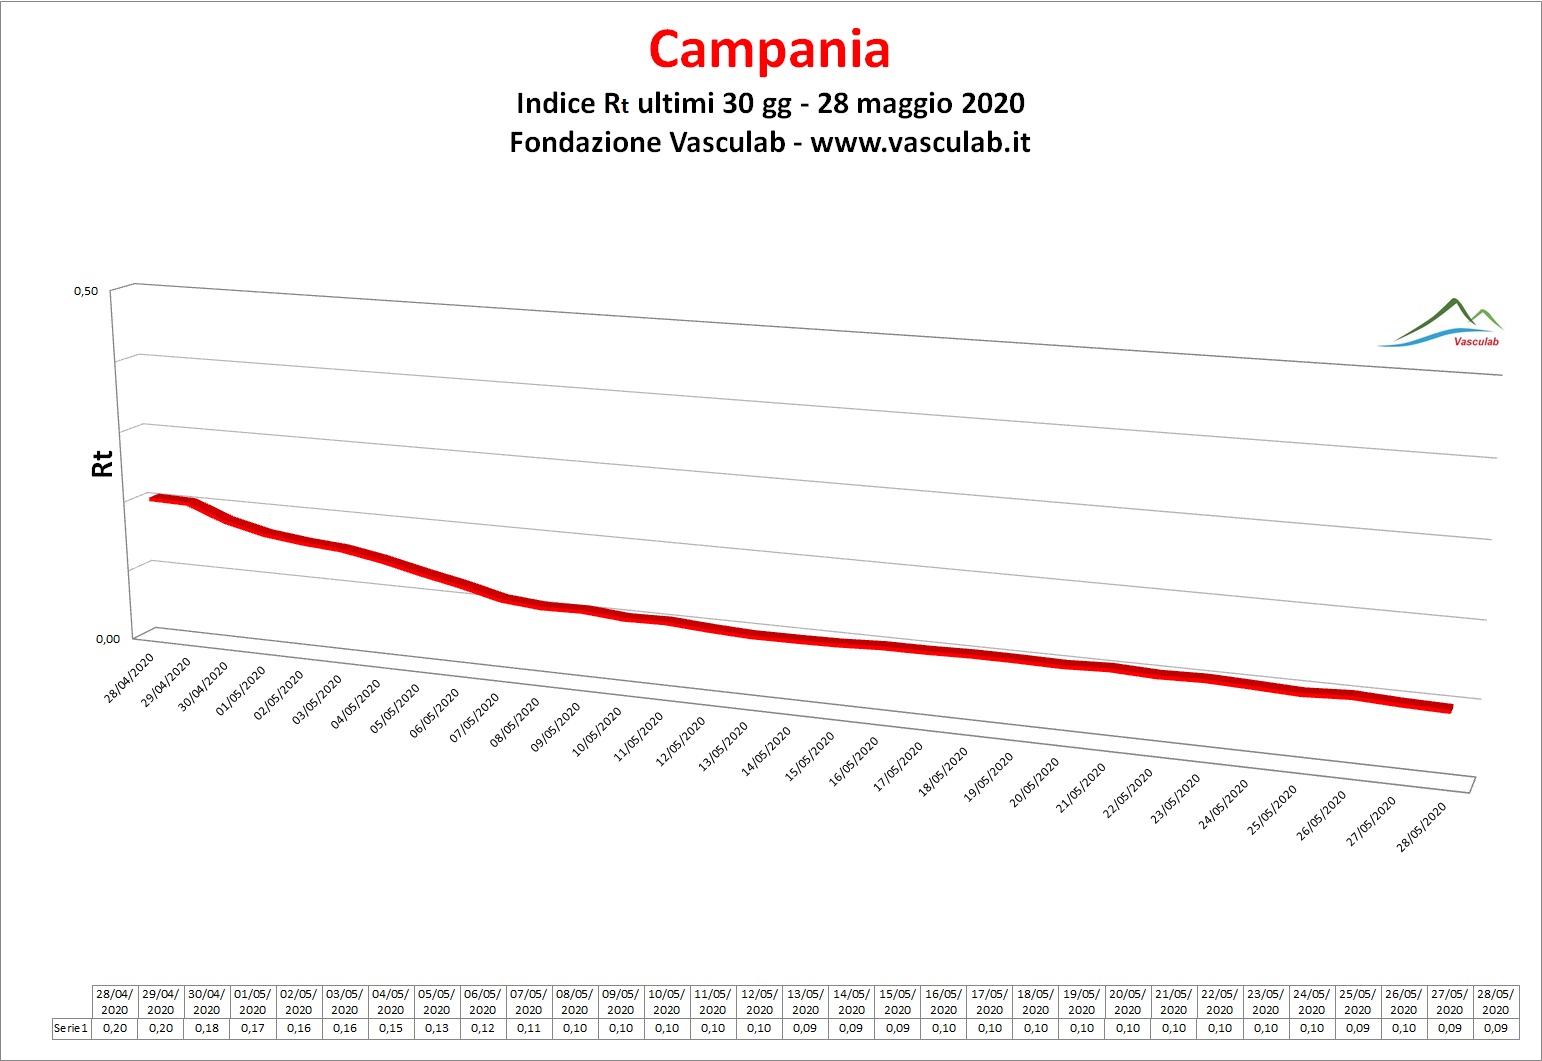 |
Lombardia | 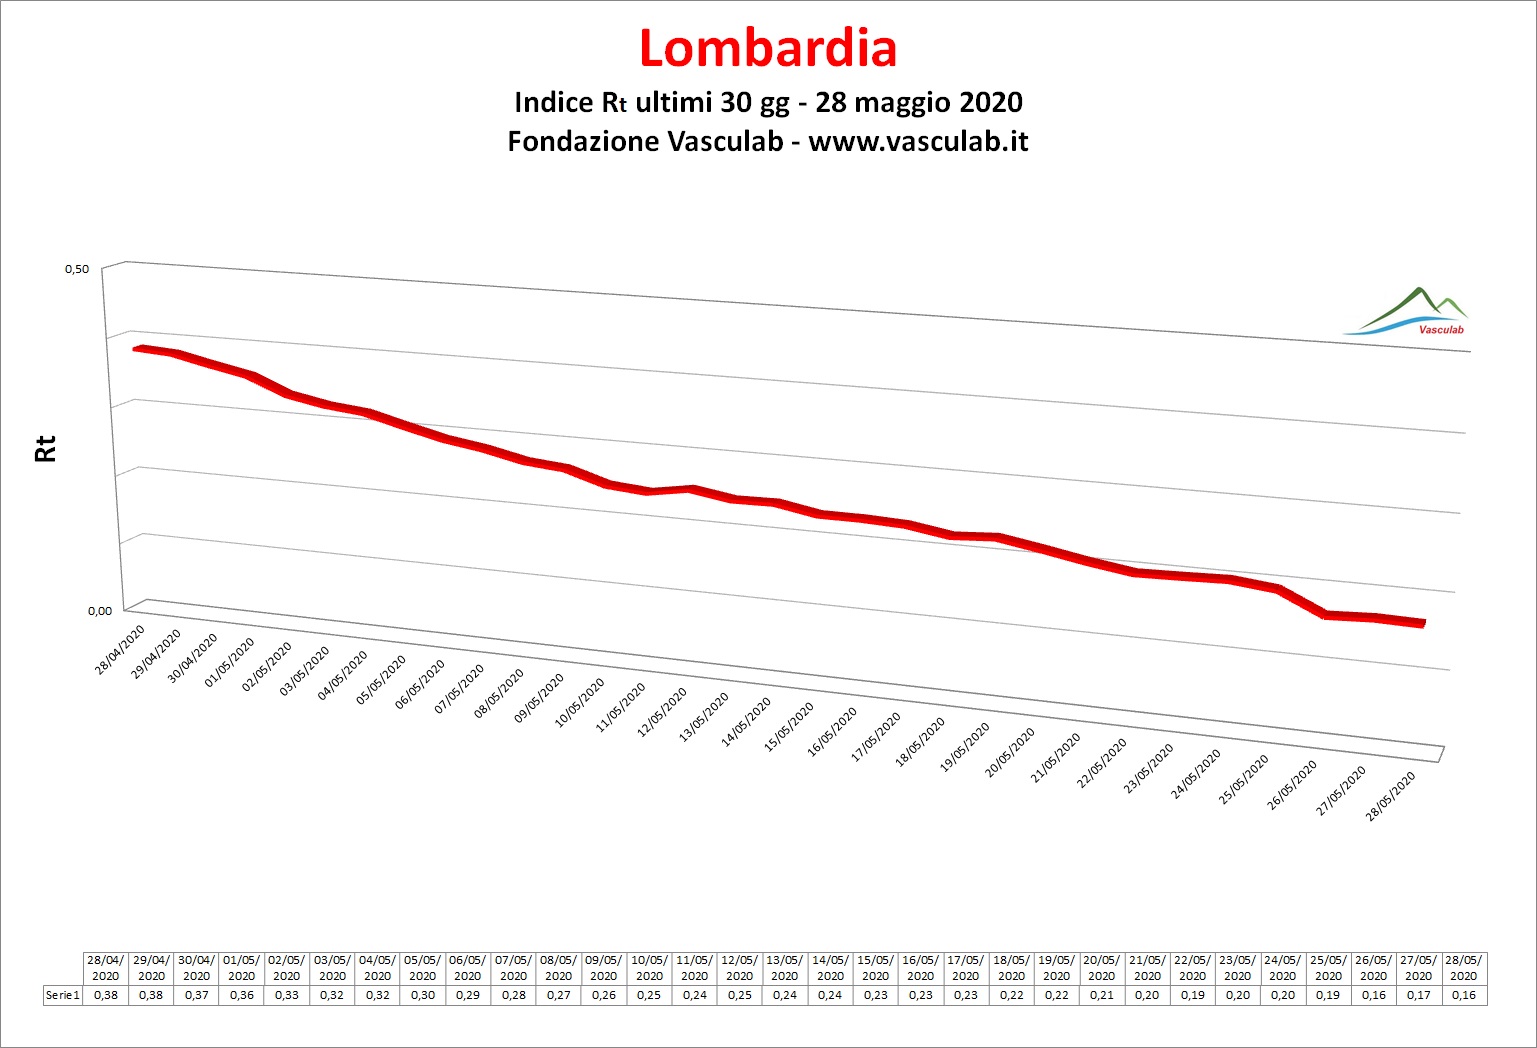 |
 |
This page http://www.vasculab.it/VLAB/covid-19/covid-19_R0%20graphs.htm
© 2020 Fondazione Vasculab impresa sociale ONLUS.